
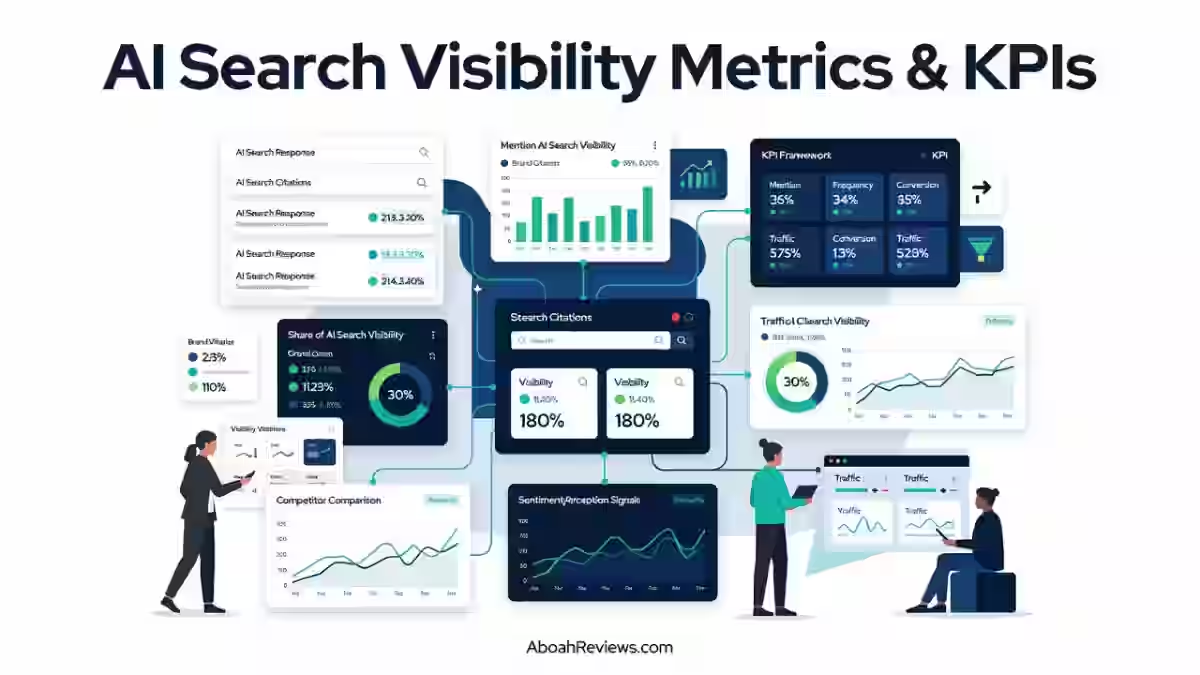
TL;DR: AI search visibility metrics and KPIs measure whether, where, how often and how accurately a brand appears in AI-generated answers across ChatGPT, Google AI Overviews, Perplexity, Gemini, Claude and Copilot. This guide breaks down 15 core metrics, from AI visibility rate to AI-assisted conversions, plus how to build a prompt set, a dashboard and a realistic tracking cadence. For SEO professionals, marketers and brand teams starting to measure GEO and AEO performance.
Introduction to AI Search Visibility Metrics KPIs
Most marketing teams already know their organic traffic numbers, keyword rankings and their click-through rates.
What they don’t know is whether their brand appears when someone asks ChatGPT to recommend a tool, asks Perplexity to compare vendors or asks Google AI Overviews to explain a category. That gap is where AI search visibility metrics KPIs come in.
This article explains what those metrics are, how to calculate them, how to interpret changes over time, and how to avoid the measurement mistakes that turn AI visibility data into noise. Whether you’re building your first AI search dashboard or refining an existing GEO measurement framework, this guide gives you a practical system you can actually use.
What Are AI Search Visibility Metrics and KPIs?
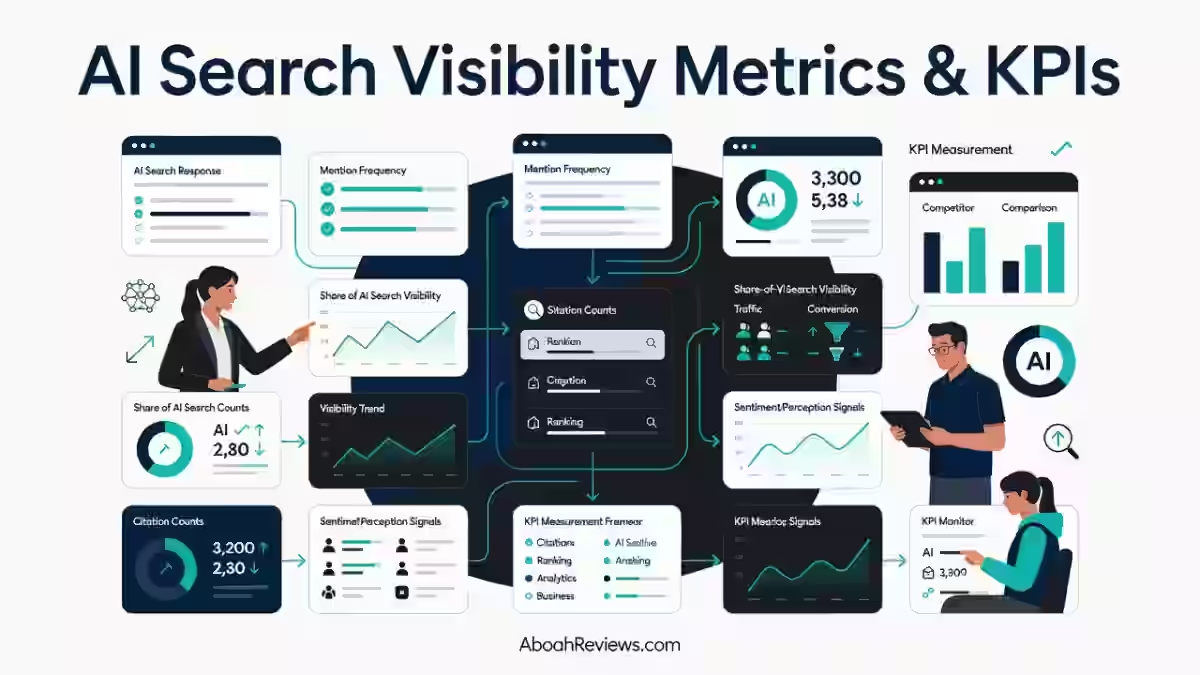
AI search visibility metrics measure whether, where and how prominently a brand or its content appears inside AI-generated answers.
They tell you things that traditional SEO metrics cannot: whether an AI system names your brand when a user asks a relevant question, whether your website is cited as a source and how you compare with competitors inside the same AI-generated response.
Traditional analytics track clicks, impressions, and rankings, but AI search creates zero-click experiences where answers are delivered directly to users without traffic events. A brand can be described, recommended or dismissed inside an AI answer without generating a single measurable session in Google Analytics.
AI search visibility metrics and KPIs, including citation frequency, AI share of voice, search visibility score and AI presence score, are the measurement layer that makes AI channel performance legible and improvable. Without them, optimization work becomes guesswork.
Measurement Funnel
The most useful way to think about AI search visibility is as a funnel with six layers:
Measurement Stage | What to Measure |
|---|---|
Visibility | Brand appearances across tracked prompts |
Citations | Sources selected and linked by AI systems |
Answer Quality | Position, accuracy, and sentiment within answers |
Competitive Position | Share of voice and competitor gaps |
Traffic | AI referral sessions and engagement behavior |
Business Impact | Conversions, assisted conversions, and revenue |
Each layer matters. Measuring only the top (appearances) while ignoring the bottom (business outcomes) produces visibility data that looks good in a report but tells you almost nothing about whether your GEO work is contributing to growth.
AI Visibility vs. Traditional SEO Visibility
Traditional SEO visibility measures position in search engine results pages, impressions and click-through rates. In traditional SEO, success is generally measured by ranking in the top three positions for a specific keyword.
In generative engine optimization, the concept of ranking gives way to the dynamics of being cited and being part of the answer.
Unlike traditional SEO, where high rankings and click-through rates were the goal, GEO requires tracking a different set of metrics and KPIs tied to how often, how favorably, and how prominently AI mentions a business.
Ranking well in Google does not guarantee inclusion in Google AI Overviews. Ranking poorly in Google does not prevent Perplexity from citing your content. The two systems select sources using different signals.
What Counts as AI Search Visibility?
Before tracking any of the 15 KPIs below, establish clear definitions for your team. The four core concepts are:
- Mention: The brand name appears in an AI-generated answer.
- Citation: A source URL from an owned or tracked domain is provided to support the answer.
- Recommendation: The AI system actively suggests the brand in response to a relevant query.
- Prominence: The position the brand or source occupies within an AI-generated response.
Brand mentions measure how often a brand is referenced in AI-generated responses. This includes plain-text mentions and linked anchor text, as long as the brand name is explicitly present. URLs or domains alone are not enough. What matters is whether the brand is part of the generated narrative.
Why Traditional SEO KPIs Are Not Enough for AI Search
1. Rankings don’t show whether AI recommends your brand
Keyword rankings and backlink authority do not reliably predict AI citations, which is why more teams are tracking traditional SEO performance and AI-answer visibility separately.
A page ranking in position one for a keyword can be completely absent from the AI-generated answer covering that same topic.
2. Traffic misses zero-click AI visibility
AI platforms do not provide flawless attribution, and zero-click exposure often occurs outside traditional analytics reporting. A user can read an AI-generated description of your product, form a clear opinion about it, and close the window without your analytics recording a single event.
AI engines also produce dark attribution where a buyer researches your brand in AI search and converts days later with no AI source visible in your analytics. Traffic-only measurement systematically undercounts AI influence.
3. AI search can influence users before the click
AI-generated answers shape brand perception before a user ever visits a website. When someone asks Perplexity to compare your product with a competitor’s, the answer they receive influences their expectations around pricing, features, and positioning.
If that answer is inaccurate, the visit that eventually follows may convert at a lower rate because the user arrives with incorrect expectations.
Traditional SEO KPIs vs. AI Search KPIs
Traditional SEO | AI Search Equivalent |
|---|---|
Keyword ranking | Prompt coverage |
SERP impressions | AI answer appearances |
Click-through rate | AI referral click behavior |
Organic traffic | AI referral traffic |
Backlinks | AI citations |
SERP share of voice | AI share of voice |
Conversion rate | AI referral conversion rate |
Revenue | AI-assisted revenue |
The key point: traditional SEO metrics should not be discarded. They should sit alongside AI-specific measurements. The goal is not perfect precision at the interaction level. It is consistent trend tracking across visibility and performance metrics to understand directional impact over time.
The AI Search Visibility KPI Framework
GEO KPIs measure the full impact, including where and how often your brand appears within AI-driven search, the volume of traffic driven to your site, lead quality, and the ultimate ROI in terms of pipeline and revenue generation.
The six-layer framework below organizes the 15 KPIs into a logical measurement hierarchy. Start at the top and build down as your measurement capability matures.
- Visibility: Is your brand present in AI answers?
- Citations: Is your content being selected as a source?
- Answer Quality: Where do you appear, and how accurately?
- Competitive Position: How do you compare with competitors?
- Traffic and Engagement: Are AI-referred visitors converting?
- Business Impact: What revenue is AI visibility contributing?
For teams just starting with GEO measurement, focus on layers 1 and 2 first. For teams that already track basic visibility, build toward layers 3 through 6.
The 15 AI Search Visibility Metrics and KPIs to Track
1. AI Visibility Rate
AI Visibility Rate measures the percentage of tracked prompts where your brand appears in an AI-generated answer.
This is the foundational metric. Before measuring citation quality, answer position, or competitive gaps, you need to know whether you appear at all.
Formula:
AI Visibility Rate = (Prompts where brand appears ÷ Total tracked prompts) × 100
Example: If your brand appears in 42 out of 100 tracked prompts, your AI Visibility Rate is 42%.
Track this weekly or biweekly for prompts that matter most to your business. One critical methodology note: define exactly what counts as an appearance before you start tracking. A vague definition leads to inconsistent counts across reporting periods.
2. AI Mention Rate
AI Mention Rate measures how frequently the brand name is referenced across your tracked prompt set.
Brand mentions measure how often a brand is referenced in AI-generated responses. This includes plain-text mentions and linked anchor text, as long as the brand name is explicitly present.
A mention does not automatically mean a citation, a recommendation, or positive representation. Your brand can be mentioned as a competitor, a cautionary example, or a lower-ranked alternative.
Formula:
AI Mention Rate = (Prompts containing a brand mention ÷ Total tracked prompts) × 100
Separate brand-positive mentions from neutral mentions and competitor-context mentions as your data matures. Blending them inflates the metric without telling you anything actionable.
3. Prompt Coverage
Prompt Coverage measures how broadly your brand appears across your full universe of relevant prompts, segmented by topic, intent, audience, and funnel stage.
A brand with a 60% AI Visibility Rate from 10 prompts may have almost zero coverage across the 90 prompts that represent its actual buyer journey. Prompt coverage exposes that gap.
Segment your prompts across:
- Topic areas (products, services, categories, problems)
- Search intent (informational, commercial, comparison, recommendation)
- Funnel stage (awareness, research, consideration, decision)
- Audience type (SMB, enterprise, specific roles)
- Geography (if location affects answers)
- Branded vs. non-branded queries
A high visibility rate from a narrow prompt set is often misleading. Prompt coverage fixes that.
4. Platform-Level AI Visibility
Platform-Level AI Visibility measures your brand’s appearance rate separately across each AI search environment you track.
AI search visibility should be measured across five engines at once: ChatGPT, Claude, Gemini, Perplexity, and Google AI Mode. A single blended score hides more than it shows.
A brand can be consistently recommended by Perplexity while being absent from Google AI Overviews, or cited frequently in ChatGPT while barely mentioned in Gemini. Blending those results into one number makes it impossible to act on either finding.
The major AI platforms to track separately in 2026:
- Google AI Overviews — the highest-volume AI surface for most brands
- Google AI Mode — conversational search with different source selection behavior
- ChatGPT — the platform with the largest AI assistant user base
- Perplexity — citation-heavy answer engine with strong commercial intent traffic
- Gemini — Google’s AI assistant
- Microsoft Copilot — relevant for B2B and enterprise audiences
Report platform-level visibility in every measurement period. Don’t let platform differences disappear inside a blended score.
5. AI Citation Rate
AI Citation Rate measures how often an AI system provides a link to your website or content as a source within an AI-generated answer.
Citation frequency measures how often AI systems reference your content in responses to relevant queries. This is the clearest signal of AI search authority. When citation frequency rises, AI platforms treat your brand as a trusted source on that topic.
Visibility and citation are not the same thing. Your brand can be mentioned frequently without your website ever being cited as a source.
That distinction matters because citations drive traffic, while mentions influence perception without generating measurable sessions.
Formula:
Citation Rate = (Prompts containing an owned-source citation ÷ Total tracked prompts) × 100
Track citation rate separately from mention rate.
If your mention rate is high but your citation rate is low, AI systems are referencing your brand based on information from other sources, not from your own content. That is a content and authority gap worth investigating.
6. Citation Share
Citation Share measures your brand’s citations as a proportion of total citations received by all tracked brands and sources across the same prompt set.
Example formula:
Citation Share = (Your citations ÷ Total tracked competitor and brand citations) × 100
Tracking these metrics requires a defined prompt set, consistent competitive scope, repeated sampling, and a platform that reports the same methodology over time.
There is no universal denominator for citation share.
Define which competitors and sources you are counting before you run the numbers, and keep that definition consistent across brands, platforms, topics, and reporting periods.
Changing the denominator between periods makes comparison meaningless.
7. Citation Quality
Citation quality evaluates whether an AI citation actually provides meaningful visibility, not just a link appearance.
Not all citations carry equal value.
A citation from a highly authoritative source that directly supports a key claim in a well-positioned answer is more valuable than a citation buried at the bottom of a long response. Or a citation linking to a page that doesn’t match what the AI answer claims.
Evaluate citation quality across:
- Source relevance — Does the cited page actually cover the topic?
- Page authority — Is the cited page well-established?
- Content freshness — Is the cited content current?
- Claim support — Does the citation support an accurate claim?
- Destination quality — Does the landing page convert or satisfy the user’s intent?
For teams building a GEO content strategy, citation quality analysis reveals which pages are earning AI citations and which pages need to be updated, restructured or replaced.
8. Answer Position
Answer position measures where your brand or source appears within an AI-generated response.
Appearing at the top of an AI-generated answer carries more weight than appearing in a final supporting source list.
Position count captures the location-based weight of the source-linked text, applying an exponential decay function to assign higher weights to earlier content, aligning with user attention bias toward preceding information.
Use a classification system such as:
- First recommendation (top of answer, primary recommendation)
- Early mention (within the first third of the answer)
- Supporting mention (middle of answer, part of a list)
- Closing source (cited at end, lower prominence)
Mention frequency alone doesn’t tell you prominence. A brand mentioned once in the opening recommendation slot has greater practical visibility than a brand mentioned three times in passing at the bottom of a long response.
9. Answer Accuracy
Answer accuracy measures whether AI systems represent your brand’s products, services, pricing and capabilities correctly.
Use AI search visibility metrics to review service descriptions, factual accuracy, entity confusion, competitor confusion, sentiment, and narrative consistency.
A visible answer that misstates the company is a reputation and conversion problem.
Inaccurate AI answers can send users to your website with incorrect pricing expectations, wrong feature assumptions, or misidentified use cases. High visibility with low accuracy is worse than simply not appearing.
Build a simple accuracy classification for every monitored answer:
Classification | Definition |
|---|---|
Accurate | AI answer correctly represents the brand |
Partially accurate | Answer is mostly correct with minor errors |
Inaccurate | Answer contains factual errors about the brand |
Outdated | Answer contains information that was once correct but is no longer |
Confused | AI conflates brand with a competitor or different entity |
Review answer accuracy monthly. Flag inaccurate answers as content priorities. Correcting the authoritative sources AI systems rely on is the primary tool for improving accuracy over time.
10. Sentiment Accuracy
Sentiment accuracy measures whether the emotional tone of AI-generated descriptions reflects the brand fairly and consistently.
Track AI-generated descriptions across four categories:
- Positive — The brand is described favorably
- Neutral — The brand is described without clear positive or negative framing
- Negative — The brand is described critically or unfavorably
- Mixed — The answer includes both positive and negative framing
An important distinction: sentiment accuracy is not the same as requiring every mention to be positive.
A brand that has genuine limitations should expect neutral or mixed AI descriptions when users ask comparative questions. The question is whether the sentiment reflects reality, not whether every mention is flattering.
Negative sentiment combined with inaccurate information is the most urgent scenario to address. Negative sentiment based on accurate information reflects a product or reputation issue that GEO alone cannot solve.
11. Recommendation Rate
Recommendation rate measures how frequently AI systems actively recommend your brand when users ask for suggestions, comparisons, or tool selections.
A recommendation is a specific, active endorsement: the AI system tells the user that your brand is a strong choice for their situation. It is meaningfully different from a mention or a citation.
Formula:
Recommendation Rate = (Prompts recommending your brand ÷ Eligible recommendation prompts) × 100
The denominator here matters: only apply this KPI to prompts where a recommendation was actually possible.
Informational prompts asking what something is don’t produce recommendations. Commercial investigation and decision-stage prompts do. Mixing prompt types inflates or deflates the rate depending on the ratio.
12. AI Share of Voice
AI Share of Voice measures your brand’s visibility relative to competitors across a defined and consistent prompt set.
Share of AI Voice measures how often a business is mentioned across AI-generated answers, also called inclusion rate or mention rate.
It is expressed as a percentage: if a business is mentioned in 5 out of 25 AI-generated responses for a given query set, its Share of AI Voice is 20%.
Share of AI Voice is most useful when measured by platform and by query rather than as a single blended number.
Example formula:
AI Share of Voice = (Your tracked brand mentions ÷ Total tracked brand mentions across all competitors) × 100
Keep the following consistent across every measurement period:
- The exact prompt set used
- The platforms measured
- The time period
- The competitor list
- The definition of a “mention”
As a marketing metric, AI share of voice fits within existing brand health dashboards alongside traditional share of voice, net promoter score, and brand search volume. It is reported as a percentage and tracked monthly or quarterly.
13. Competitor Visibility Gap
Competitor Visibility Gap measures the difference between your AI visibility rate and a specific competitor’s visibility rate across the same prompt set.
Example:
- Your AI Visibility Rate: 38%
- Top competitor AI Visibility Rate: 52%
- Visibility gap: -14 percentage points
Track the gap against:
- Your primary competitor
- Your top three competitors
- The category average (if trackable)
A growing negative gap indicates competitors are gaining ground in AI answers. A gap that narrows over time confirms that your GEO optimization work is producing results. Neither observation is meaningful unless the prompt set and methodology remain consistent.
14. AI Referral Conversion Rate
AI Referral Conversion Rate measures the percentage of sessions arriving from identified AI platforms that result in a tracked conversion.
Formula:
AI Referral Conversion Rate = (AI-referred conversions ÷ AI referral sessions) × 100
Google Analytics 4 now includes a dedicated AI Assistant channel in its Default Channel Group reports.
The new channel makes it easier to track clicks from AI sources, identify which AI platforms are sending traffic, and compare AI referral performance against traditional organic search, all within GA4’s standard reporting interface.
However, there are important limitations. Perplexity still lands in Referral, AI Overviews count as Organic Search, and most AI traffic never carries a referrer at all.
The AI referral traffic visible in standard analytics reports is an undercount of actual AI-influenced visits.
For teams that need more complete attribution, supplementing GA4 with a dedicated AI visibility tracking tool is worth considering.
15. AI-Assisted Conversions
AI-Assisted Conversions measure conversions where AI search appears earlier in the customer journey, even when it is not the last recorded touchpoint before conversion.
This KPI requires a multi-touch attribution model rather than last-click attribution.
A user who asks ChatGPT about your product category, visits your site three days later via organic search, and converts will be counted as an organic conversion in a last-click model.
AI-assisted conversion measurement attempts to credit the AI touchpoint that may have initiated the journey.
AI engines produce dark attribution where a buyer researches your brand in AI search and converts days later with no AI source visible in your analytics.
An important warning: do not present assisted conversions as proof that an AI platform caused the conversion unless your attribution methodology explicitly supports that conclusion.
Multi-touch attribution requires careful setup and even then involves modeling assumptions. Present these numbers as directional indicators of AI influence, not as precise causal claims.
Supporting AI Search Metrics Worth Tracking
The following metrics add analytical depth without inflating the primary KPI framework. They are useful once the core 15 KPIs are in place.
Visibility Velocity
Visibility velocity measures the rate of change in your AI visibility rate over time, rather than the absolute number.
Formula:
Visibility Velocity = (Current visibility rate − Previous visibility rate) ÷ Previous visibility rate × 100
A visibility rate of 38% is less informative than knowing it grew from 24% to 38% in 60 days. Velocity puts change in context.
Citation Volatility
Citation volatility measures how frequently the set of sources an AI system cites changes between measurement periods.
High citation volatility for a prompt suggests the AI system is uncertain about which sources to trust on that topic, which is an opportunity to establish clearer topical authority.
Outdated Information Rate
Track how many monitored AI answers contain outdated information about your brand: old pricing, discontinued products, superseded features, or former company information.
Some teams call this the AI answer inclusion rate. Consistency matters more than any single snapshot. Outdated answers require fixing the source documents AI systems reference, not just the AI answer itself.
AI Referral Traffic
AI referral traffic already reached 6.4% of traffic for B2B tech firms by January 2026.
Track total sessions, bounce rate, pages per session, and goal completion rates for AI-referred visitors. Compare their behavior with organic search visitors to understand whether AI-referred traffic is high-intent or exploratory.
How to Build an AI Search Prompt Set
The quality of your measurement depends almost entirely on the quality of your prompt set.
A poorly constructed prompt set produces data that looks actionable but doesn’t represent how real users actually query AI systems.
Start With Your Target Topics
Build prompts around:
- Products and services
- Problems your customers are trying to solve
- Category and comparison queries
- Competitor comparison queries
- Audience-specific use cases
Cover Different Search Intents
Include all five major intent types:
- Informational — “What is [category]?”
- Commercial investigation — “What are the best [product type] tools?”
- Comparison — “[Brand A] vs [Brand B]”
- Recommendation — “Which [product type] should I use for [use case]?”
- Decision-stage — “Is [Brand] worth it for [specific need]?”
Separate Branded and Non-Branded Prompts
Branded prompts (queries that include your brand name) answer different questions than non-branded prompts (queries about your category without mentioning your brand).
Combining them produces a blended rate that obscures both.
- Branded example: “What is [Brand] used for?”
- Non-branded example: “What are the best project management tools for remote teams?”
Report them separately. A brand can perform very well on branded prompts while being virtually absent from non-branded category queries.
Include Competitor Prompts
Examples:
- “[Competitor] alternatives”
- “Best tools like [Competitor]”
- “[Your brand] vs [Competitor]”
- “Best [category] tools for [audience]”
These prompts reveal where AI systems mention your brand as an alternative and where they recommend competitors over you.
Determine an Appropriate Sample Size
Very small prompt sets produce unstable percentages.
A brand appearing in 4 of 10 prompts has a 40% visibility rate. Remove one prompt from the set and it’s 33%. That kind of movement from a one-prompt change is not a meaningful trend.
There is no universal sample size recommendation because the right number depends on how many topics, competitors, and platforms you track.
As a general principle: the larger and more diverse your tracked prompt set, the more reliable your percentage metrics will be.
How to Measure AI Search Visibility Consistently
Consistency is one of the biggest weaknesses in how most teams measure AI search visibility. Without consistent methodology, you’re comparing different numbers under the same label.
Keep the Same Prompt Set for Comparisons
Don’t add, remove, or reword prompts between measurement periods unless you treat the revised set as a new baseline. Any change to the prompt set changes the denominator and makes period-over-period comparisons unreliable.
Track Platforms Separately
AI search visibility should be measured across five engines: ChatGPT, Claude, Gemini, Perplexity, and Google AI Mode.
Never merge their results into a single blended score unless you’re producing a top-level summary, and even then, always show the platform breakdown beneath it.
Record Every Observation With the Same Fields
For each measured prompt, record:
Field | Example |
|---|---|
Platform | Perplexity |
Prompt | Best SEO tools for agencies in 2026 |
Search intent | Commercial investigation |
Brand mentioned | Yes |
Recommended | Yes |
Cited | Yes |
Citation URL | /tools/agency-seo |
Citation position | 1 of 4 sources |
Competitors mentioned | 3 |
Answer accuracy | Accurate |
Sentiment | Positive |
Date measured | September 2026 |
This structured record makes it possible to analyze trends, spot accuracy issues, identify competitor patterns, and build meaningful dashboards.
Keep Denominators Consistent
No independent cross-platform accuracy benchmark had been published as of mid-2026.
The most reliable evaluation method is to run a pilot with your own prompt set across two or three candidate platforms and compare consistency of results.
When building your own measurement system, document your denominator definition and apply it identically across every report.
How to Build an AI Search KPI Dashboard
Start with three audience-specific views built from the same underlying data.
Executive Dashboard
Show leadership the metrics that connect to business outcomes:
Metric | Measurement |
|---|---|
AI Visibility Rate | % of tracked prompts |
Citation Rate | % of tracked prompts |
AI Share of Voice | % vs. tracked competitors |
Recommendation Rate | % of eligible prompts |
Answer Accuracy | % of answers reviewed |
AI Referral Traffic | Sessions/month |
AI Referral Conversions | Conversions/month |
SEO and GEO Team Dashboard
Add operational depth for the team managing content and optimization:
- Topic-level visibility breakdown
- Prompt coverage map (which topics have gaps)
- Most-cited pages across platforms
- Platform-level visibility comparison
- Competitor visibility gaps by topic
Content Team Dashboard
Surface the signals content writers and strategists need:
- Most-cited pages and what topics they cover
- Topics with zero citation coverage
- Pages with outdated information flagged in AI answers
- Competitors being cited on topics where your brand is absent
- Prompt clusters where answer quality is low
How Often Should You Track AI Search KPIs?
AI visibility scores are directional signals, not perfect truth. Because AI outputs are dynamic and vary across sessions, individual scores carry uncertainty.
Reliable strategic use requires repeated sampling, trend analysis over time, and treating the data as distributions rather than fixed rankings.
Use this cadence as a starting point and adjust based on your prompt volume and resource availability:
KPI | Suggested Cadence |
|---|---|
AI Visibility Rate | Weekly or biweekly |
AI Mention Rate | Weekly or biweekly |
Platform-Level Visibility | Weekly or biweekly |
Citation Rate | Weekly or biweekly |
Citation Share | Weekly or monthly |
Prompt Coverage | Monthly |
Citation Quality | Monthly |
Answer Position | Weekly or monthly |
Answer Accuracy | Monthly |
Sentiment Accuracy | Monthly |
Recommendation Rate | Weekly or monthly |
AI Share of Voice | Monthly |
Competitor Visibility Gap | Monthly |
AI Referral Conversion Rate | Monthly |
AI-Assisted Conversions | Monthly or quarterly |
One caution: don’t treat a single week’s movement as a trend. Even with the right KPIs defined, measurement can still drift off course.
AI search introduces new signals, but it also introduces new ways to misread performance. Trends require at least 4-6 consistent measurement periods before they mean anything.
How to Benchmark AI Search Visibility
Establish Your Own Baseline First
Before asking what a “good” AI visibility rate looks like, measure your current rate. You cannot benchmark against an industry standard that doesn’t exist yet. Your starting point is your real baseline.
Benchmark Against Competitors, Not Industry Averages
Use the same prompt set, the same platforms, the same measurement periods, and the same definitions to compare your visibility with specific named competitors.
GEO metrics capture this change by measuring signals such as brand mentions, visibility, share of voice, sentiment, and citations, which together show how often a brand appears, how it is framed, and how it compares to competitors.
Rather than focusing only on downstream outcomes, they measure relative visibility, brand presence, and share of voice within generative search systems.
Benchmark by Topic and Platform
Identify four categories of topic performance:
- Topics where you lead — Protect and strengthen these
- Topics where you match competitors — Small content improvements may shift the balance
- Topics where competitors lead — Content and authority gaps to close
- Topics where nobody has strong visibility — Early-mover opportunity for topical authority
Don’t Use Universal Benchmarks
A “good” AI visibility rate varies by industry, brand awareness, prompt set composition, competition level, platform, and search intent.
A 30% AI visibility rate might represent strong performance for a niche B2B SaaS brand but weak performance for a major consumer brand in a competitive category.
How to Interpret Changes in AI Search Visibility
Changes in AI visibility metrics are rarely self-explanatory. Here is how to interpret the most common patterns.
Visibility Increased but Citations Fell
The brand is being mentioned more frequently, but its owned content is no longer being selected as a source.
Likely cause: third-party sites (review platforms, comparison sites, news coverage) are being referenced instead of your own pages.
Investigate which sources AI systems are now citing for those prompts and whether your content is outdated or lower-authority than those alternatives.
Citations Increased but Traffic Stayed Flat
Share of voice is the metric that turns presence into a competitive read, because AI answers typically name three to five brands and there is no page two.
Your source mix tells you where the work is. If most of what an assistant cites about you sits on other people’s websites, optimizing your own pages will not move the number.
Additionally, if citations are increasing but traffic is flat, users may be satisfied by the AI answer without needing to click through. That is not always a problem: if the user finds what they need, brand recall and consideration may still be increasing.
AI Traffic Increased but Conversions Declined
Investigate:
- Whether the landing page matches the intent of the AI-referred user
- Whether the AI answer created expectations your website doesn’t immediately address
- Whether the conversion flow has friction points that organic search visitors navigate more easily
Competitor Visibility Increased While Yours Stayed Flat
Check:
- Whether a competitor published new content on topics where you share visibility
- Whether a competitor earned new third-party citations (press, reviews, partnerships)
- Whether your content on those topics has become outdated
- Whether prompt coverage gaps exist that competitors have filled
Visibility Drops Sharply Across One Platform
Don’t immediately assume a content problem. Check:
- Whether the AI platform updated its source selection criteria
- Whether your measurement tool changed its methodology
- Whether crawl access to your site has changed
- Whether the prompt set was modified
Platform-level drops often reflect platform-side changes more than content failures.
Common AI Search KPI Measurement Mistakes to Avoid
Treating Mentions as Citations
A mention means your brand name appeared. A citation means your content was selected as a source.
A recommendation means the AI actively suggested your brand. These are three different signals that require separate tracking.
Using Too Few Prompts
Small datasets create unstable percentages. A brand appearing in 4 of 10 prompts has a 40% rate. Remove one prompt and it drops to 33%.
That 7-point shift means nothing about actual performance. Increase sample size before drawing conclusions.
Mixing Branded and Non-Branded Prompts
These answer completely different questions. Branded prompts test entity recognition and accurate representation.
Non-branded prompts test category-level visibility and competitive positioning. Combining them creates a rate that neither question can fully explain.
Combining Every AI Platform into One Score
Platform differences disappear inside a blended score. A single blended score hides more than it shows. Always report platform-level visibility before presenting any aggregate number.
Using Inconsistent Denominators
Changing the set of prompts, competitors, or platforms between reporting periods makes all percentage comparisons meaningless. Document your methodology and enforce it consistently.
Treating Correlation as Attribution
An increase in AI visibility at the same time as a revenue increase does not prove that AI visibility caused the revenue increase.
Attribution requires a methodology, not a coincidence. Present correlated trends honestly and clearly distinguish them from causal claims.
Optimizing for Visibility Alone
AI visibility without accuracy, citations, competitive positioning, and business impact is a vanity metric. AI-driven engagement must connect to business outcomes.
GEO tracking should link generative awareness to lead quality, pipeline growth, and brand perception. This reveals where AI exposure translates into measurable impact.
What Are the Most Important AI Search KPIs?
Not every team needs all 15 KPIs simultaneously. Here is a prioritization framework:
Tier 1: Core Visibility (Start Here)
- AI Visibility Rate
- AI Citation Rate
- AI Share of Voice
Tier 2: Quality and Competitive Performance (Add Next)
- Answer Position
- Citation Quality
- Answer Accuracy
- Recommendation Rate
- Competitor Visibility Gap
Tier 3: Business Impact (Build Toward)
- AI Referral Conversion Rate
- AI-Assisted Conversions
Supporting Metrics (Add as Needed)
- AI Referral Traffic
- Visibility Velocity
- Citation Volatility
- Outdated Information Rate
- Sentiment Accuracy
Start with Tier 1 and establish a clean baseline before adding complexity. Trying to build a 15-KPI dashboard before you have reliable data for three core metrics is a common mistake that produces busy dashboards rather than useful measurement.
AI Search Visibility Metrics by Platform
The same measurement framework applies across platforms, but each platform has its own characteristics that affect how metrics behave.
Google AI Overviews
Google AI Overviews represents the highest-volume AI surface for most brands. Most often triggered on informational and consideration-stage queries, integrated directly into Google Search.
AI Overview appearances do not generate a separate traffic channel in GA4; they are counted as Organic Search sessions, which makes direct AI Overview attribution difficult without Search Console’s AI Overviews reporting.
Google launched dedicated Search Console generative AI performance reports covering AI Overviews and AI Mode in June 2026, but these report impressions only, no click, CTR, or query breakdown yet, and are still rolling out.
Google AI Mode
Google AI Mode operates as a more conversational, multi-turn search experience.
Source selection behavior may differ from AI Overviews even within the same query topic. Track it as a separate platform rather than assuming it mirrors AI Overviews performance.
ChatGPT
ChatGPT represents a significant brand discovery channel, particularly for B2B and technology categories.
As of September 2026, GA4 automatically classifies traffic from recognized AI chatbots, including ChatGPT, Gemini, and Claude, into a dedicated “AI Assistant” session channel group.
Recommendation-stage prompts tend to produce the most commercially valuable appearances on ChatGPT.
Perplexity
Perplexity is citation-heavy by design. It surfaces sources visibly alongside answers, making citation tracking more straightforward here than on other platforms.
Perplexity, one of the highest-intent AI traffic sources, is not in the GA4 AI Assistant channel and still lands in Referral.
Supplement GA4 data with server-side logs or a dedicated tracking tool to capture Perplexity referrals accurately.
Gemini
Gemini is Google’s AI assistant. Its source selection overlaps with Google AI Overviews in some respects but is not identical.
Track them separately. Gemini sessions are captured by GA4’s AI Assistant channel.
Microsoft Copilot
Copilot is particularly relevant for B2B brands targeting enterprise and Microsoft ecosystem audiences.
According to one 2026 comparison, Semrush and Ahrefs both cover ChatGPT, Google AI Overviews, Google AI Mode, and Gemini.
Ahrefs also reportedly covers Perplexity, Grok, and Copilot. If Copilot visibility matters to your audience, confirm that your chosen tracking tool actually covers it before selecting your measurement platform.
Tools That Track AI Search Visibility KPIs
Several platforms now offer structured AI visibility tracking across multiple measurement dimensions.
The market is evolving quickly; pricing and platform coverage should be confirmed directly with vendors before purchasing.
Semrush One combines the capabilities of traditional SEO and AI search visibility into one plan. You can monitor traditional online visibility alongside AI search without needing a separate tool for AI monitoring.
Semrush AI Visibility tracks brand presence in AI-generated answers and provides mention counts and share-of-voice metrics relative to tracked competitors. Coverage spans four to six platforms depending on plan configuration.
Ahrefs Brand Radar is an AEO and AI visibility tool that tracks and optimizes a brand’s AI visibility across generative AI engines. Brand Radar processes 370 million prompts across all LLMs every month.
Pricing is structured per platform rather than as a bundled suite, starting at $199/month per platform. Note: pricing figures are drawn from third-party reporting and should be confirmed with Ahrefs directly.
AthenaHQ is a purpose-built GEO platform that monitors 8+ LLMs, including ChatGPT, Perplexity, Gemini, and Claude, and turns citation data into prioritized actions. It runs on a single subscription plus credits, with unlimited seats included from the entry tier.
Existing SEO platforms like Ahrefs, Semrush, SE Ranking, and Conductor have added AI visibility tracking as features within their broader platforms. These are best for teams already paying for a major SEO suite who want AI tracking as an extension.
For a more detailed look at the current tool landscape, my comparison of AI visibility tracking tools covers platform coverage, prompt limits, pricing, and reporting in detail.
Feature | Semrush AI Visibility | Ahrefs Brand Radar | AthenaHQ | SE Ranking AI |
|---|---|---|---|---|
AI platforms covered | 4-6 (plan-dependent) | 5-7 (reported) | 8+ | 4 |
Integrated with SEO suite | Yes | Yes | No | Yes |
Purpose-built for GEO | No | Partial | Yes | No |
Competitor tracking | Yes | Yes | Yes | Yes |
Citation monitoring | Yes | Yes | Yes | Yes |
Sentiment tracking | Partial | Partial | Yes | Yes |
Pricing structure | Higher paid tier | Add-on per platform | Subscription + credits | Add-on module |
Note: Platform coverage and pricing reflect third-party reports from mid-2026. Verify current figures directly with each vendor.
For teams choosing between platforms: for most teams, the deciding factor is which SEO suite you already own. Switching platforms just for AI visibility rarely makes sense.
If you use neither today, Semrush offers the lower entry price. If Claude or Meta AI visibility matters to your brand, Ahrefs is the stronger pick.
The Primary Recommendation: Measure What You Can Act On
The best AI search measurement system is not the most comprehensive one. It is the one your team can maintain consistently, interpret correctly, and connect to decisions about content, GEO strategy, and resource allocation.
A priority framework for getting started:
If you’re starting from zero:
Track AI Visibility Rate, AI Citation Rate, and Platform-Level Visibility across your 30-50 most important prompts. Establish a 60-day baseline before drawing any conclusions.
If you have basic visibility data:
Add Answer Accuracy, Competitor Visibility Gap, and AI Share of Voice. Start connecting visibility data to content priorities.
If you have a mature measurement system:
Add AI Referral Conversion Rate, Answer Position, Citation Quality, and AI-Assisted Conversions. Begin connecting GEO performance to revenue reporting.
For teams building a complete GEO measurement framework, the progression above is more practical than attempting to deploy all 15 KPIs simultaneously.
Final Takeaway
Knowing your AI search visibility metrics and KPIs is not the end goal. The goal is a measurement system that connects:
Presence → Citations → Answer Quality → Competitive Position → Traffic → Conversions → Revenue
Traditional SEO metrics still matter and should not be abandoned. For years, competitive visibility in search was closely tied to performance metrics such as rankings, traffic, and clicks.
In AI-driven search systems like Gemini, Google AI Mode, ChatGPT, and Perplexity, those signals are no longer fully visible or consistent. Both measurement layers need to coexist in your reporting.
The 15 KPIs covered in this article give you a complete measurement architecture. Start with the core three, build toward quality and competitive metrics, and connect the results to business outcomes as your data matures.
Visibility without accuracy, context, and business relevance is just another vanity metric with a new name.
For teams evaluating which tools can track these KPIs at scale, my AI visibility tool reviews break down what each platform actually measures, its limitations, and who it is best suited for.
Frequently Asked Questions About AI Search Visibility Metrics KPIs
How do you monitor AI search visibility?
AI search visibility is monitored by tracking a defined set of prompts across AI platforms like ChatGPT, Perplexity, Gemini, and Google AI Overviews, then recording whether your brand appears, whether it is cited, and where it is positioned within each answer. Dedicated platforms like AthenaHQ, Semrush AI Visibility, and Ahrefs Brand Radar automate this process. GA4’s AI Assistant channel, added in May 2026, also tracks referral sessions from recognized AI chatbots.
What is the 30% rule in AI search?
The 30% rule in AI is a flexible guideline used to balance automation and human oversight in work, school, and data projects. Because it is a general principle rather than a strict law, people apply it in a few different ways depending on the context.
- The Split: Artificial intelligence handles about 70% of routine, repetitive, or data-heavy work.
- Human Role: Humans keep the remaining 30% of the task for critical thinking, review, values, and final approval.
- Goal: This prevents mistakes, bias, and blind trust in machines.
What is a good AI visibility score?
A good AI visibility score is usually above 50 out of 100, though benchmarks depend entirely on your industry and how you compare against direct competitors. An AI visibility score measures how often, prominently, and favorably AI search tools (like ChatGPT, Gemini, and Perplexity) mention or cite your brand.
How is AI visibility measured?
AI visibility is measured by tracking how often, how prominently, and in what tone a brand or website is mentioned, recommended, or cited in AI-generated search results and chat tools.
What is the difference between an AI mention and an AI citation?
An AI mention means your brand name appears in a generated answer. An AI citation means the AI system provides a link to your website or content as a source supporting that answer. Instead of classic SERP rankings, the number and order of citations within the AI answer should be tracked. A brand can be mentioned frequently without its website ever being cited. Both metrics should be tracked separately.
Can AI visibility metrics be tracked in Google Analytics?
Partially. Google Analytics 4 now includes a dedicated AI Assistant channel in its Default Channel Group reports. The new channel makes it easier to track clicks from AI sources, identify which AI platforms are sending traffic, and compare AI referral performance against traditional organic search. However, Perplexity sessions still appear in Referral, Google AI Overviews count as Organic Search, and zero-click AI interactions generate no session data at all. GA4 should be supplemented with a dedicated AI visibility tracking tool for complete measurement.
How frequently should AI search KPIs be reviewed?
Core visibility metrics like AI Visibility Rate and Citation Rate should be reviewed weekly or biweekly using consistent prompt sets. Quality metrics like Answer Accuracy and Sentiment should be reviewed monthly. Business-impact metrics like AI Referral Conversion Rate and AI-Assisted Conversions should be reviewed monthly or quarterly. Reliable strategic use requires repeated sampling, trend analysis over time, and treating the data as distributions rather than fixed rankings.

- Searchable Review 2026: My 30 Days Hands-on Full Breakdown - September 23, 2026
- AI Search Visibility Metrics & KPIs: 15 Metrics to Track in 2026 - September 12, 2026